INTRODUCTION
The Most Valuable Player (MVP) award always provides a glimpse into how each unique baseball mind operates. Do you prefer the uber successful player who performed in the clutch down the stretch to help his team sneak into the postseason? Maybe your taste is more geared towards the player with the highest WAR total, regardless of his team’s contention or record. What about simply choosing the best player on the league’s best team? All of these options are reasonable and can be argued intelligently – that’s the fun of an MVP debate. Afterall, value is subjective.
Let’s break down a specific example: In 2010, Albert Pujols finished 2nd in the MVP race, slashing .312/.414/.596 to go along with 42 HR, 118 RBI, and 6.8 fWAR. Pujols’ Cardinals finished 86-76, falling short of the postseason. In the same year, Juan Uribe was on no one’s MVP list, slashing just .248/.310/.440 with 24 HR, 85 RBI, and 2.7 fWAR; however, Uribe’s Giants finished 92-70, sneaking into the postseason just two games ahead of the Padres, and blazed their way right to a World Series Championship (WSC). No one in their right mind would argue that Uribe’s performance was more valuable than Pujol’s. Yet… if you took Pujols and Uribe off their respective team’s roster and plugged in a replacement-level player… Pujols Cardinals would probably still have finished 2nd in the NL Central ahead of the 77-85 Brewers – perhaps making a forgettable season slightly more forgettable. But Uribe’s Giants? Well, then San Francisco may not have enjoyed their first World Series (WS) parade since 1954. So, I would be happy to argue that Uribe’s season was more critical to his organization’s overall success than Pujol’s season was to his organization.
The intention of this exercise is to create a more objective and contextualized approach to understanding a player’s impact on his team. Let’s call it the Most Critical Player (MCP) award.

This exercise will focus on the Major League Baseball (MLB) Wild Card era only and will attempt to define, evaluate, and compare regular-season contributions towards organizational accomplishments.
METHODOLOGY
NOTE: This exercise is not intended to demonstrate or leverage any complicated mathematical concepts and theories. If interested, perhaps someone smarter than I am can better model a way to compose MCP rubric and evaluations.
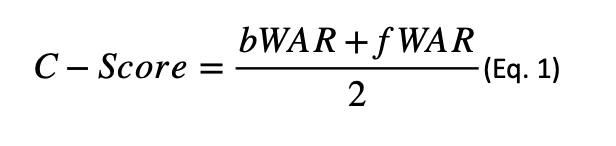
Now it’s important to clarify that the MCP award will still value outstanding performances over smaller performances, all else being equal. For example, Aubrey Huff’s .290/.385/.506, 26 HR, 86 RBI, 5.7 fWAR season is still more critical to the 2010 San Francisco Giants WSC opportunity than Uribe’s was. Let’s start by defining the base measurement in this exercise: the Criticality Score (C-Score). If you are reading this article, you likely know that Wins Above Replacement (WAR) is an (inexact) attempt to summarize a player’s performance into one statistic. WAR essentially estimates the additional wins a player adds to his team, given the alternative in which he is replaced by a AAAA-level player. Let’s simply define the C-Score as the average of Baseball Reference WAR (bWAR) and Fangraphs WAR (fWAR), rounded to the nearest whole number.
 Furthermore, the crux of the MCP award is that a player’s performance matters more in context 1) organizational success and 2) the (hindsight) fragility of that success. Let’s define each of these parameters, looking at “fragility of success” first.
- FRAGILITY OF SUCCESS
The Pujols-Uribe example earlier touched on this idea a bit. When a player’s contributions are the literal difference between making or missing the postseason, this a heck of a lot more critical than a player’s contributions to a team missing the playoffs or a team finishing the season with a 20-game lead over 2nd place.
To be considered for MCP, a player shall 1) performed for a team that qualifies for a postseason and 2) finishes with a C-Score that exceeds the total game lead his team finished the season with over the best non-postseason team.
- ORGANIZATIONAL SUCCESS
Get a Mets fan and a Yankees fan in a room and they might not agree on much. But they would all agree on one thing – team success hinges, simply, on winning. Heck, ESPN just made a documentary on the ’86 Mets a full 35 years after Mookie Wilson poked a grounder through Bill Buckner’s legs. Meanwhile in the next borough, Yankees fans have not yet developed coping skills to handle seasons that end in September. Winning, specifically postseason success, means everything.
So, to quantify “winning” with regards to a player’s C-Score, I think it makes sense to normalize an adjustment around a WSC. I propose the following:
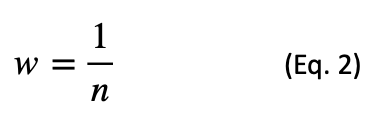
where: w = weighted adjustment to the C-Score.
n = number of teams left in contention at time of elimination (or WSC)
Ultimately, this would look something like this, setting “Lost in Wild Card Series (WCS)” to half of the weighted adjustment of “Lost in League Divisional Series (LDS)” since a team would have roughly a 50% chance of advancing:
| WSC | n = 1 | wWSC = 1.0000 |
| Lost WS | n = 2 | wWS = 0.5000 |
| Lost League Conference Series (LCS) | n = 4 | wLCS = 0.2500 |
| Lost League Divisional Series (LDS) | n = 8 | wLDS = 0.1250 |
| Lost Wild Card Series (WCS)* | N/A | wWC = 0.0625 |
*Applies only to the Two-Team Wild Card Era (2012-present)
These values are somewhat arbitrary, but I would argue a World Series appearance-but-loss feels about 50% as satisfying as a World Series win, so I think this ends up being reasonable.
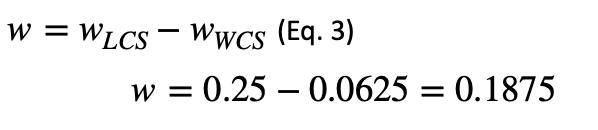
With just one last problem to solve, let’s look at the 2018 Astros: They finished 103-59, 6 games ahead of the 2nd place Athletics. Great, so any C-Score that exceeds 6 would qualify an Astros player for MCP award consideration? Well, the Astros also finished 13 games ahead of the 90-72 Rays, the closest runner up for a Wild Card berth, meaning that the Astros could have lost 13 extra games and still qualify for a postseason appearance. So, should the C-Score threshold be 13? Well, certainly any C-Score to exceed 13 should count fully. After the proposed weighted adjustments above, my proposal for a player falling between that C-Score of 6 and 13, using the 2018 Astros (who lost in the American League Conference Series) as an example:
Unfortunately, this solves the problem for Two-Team Wild Card Era, but this same sort of adjustment is not applicable to the One-Team Wild Card Era. So, for the One-Team Wild Card Era, let’s just set the C-Score threshold to the larger value; the total number of games a team is ahead of the runner up for a postseason berth in general.
Finally, a players weighted C-Score (wC) would simply be the product of the raw C-Score and the weighted adjustment:
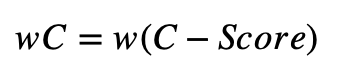
From here, players can be compared position-by-position, team-by-team, year-by-year, etc.
RESULTS/CONCLUSIONS
A yearly Most Critical Player was determined for the AL and NL from 1995 to 2021 (leaving out COVID-shortened 2020). The results are displayed in Table 1 in the Appendix. A healthy mix of positions are represented with pitcher (15 winners), 3B (11), and 2B (8) with the most frequent MCP winners. Among the least represented included 1B (2), CF (3), and RF (4). Teams with the most winners include the Red Sox in the AL with 7 MCPs and the Cardinals leading the NL with 7 winners.
Franchise leaders in total weighted C-score were also determined. The results are displayed in Table 2 in the Appendix. For obvious reasons, impact contributors of World Series winners and perennial playoff contenders lead the way for many teams. It is worth remembering that players on teams with either 1) frequent lack of contention or 2) continued dominance, would have limited opportunities to rack up significant wC numbers. This seems to mute the total wC for players on the Orioles, White Sox, Angels, Pirates (and others) for reason #1; the Yankees, Dodgers, Braves (and others) for reason #2; the Cubs, Indians, Rays (and others) for a combination of reasons #1 and #2. I think this table also serves to remind us how fragile the historic runs of the Giants and Cardinals were. The impact of both Posey and Pujols, respectively, may have been the difference between these teams being known as perennial WS contenders (and sometimes winners) versus teams that struggled to even make the playoffs year-after-year.
Finally, Table 3 in the Appendix neatly summarizes the Top 5 most impactful players from 1995 to 2021, with regards to Total Career wC. No surprise here as each player on here not only contributed to magical seasons ending with WS victories, but also is either in the Hall of Fame (Johnson), bound for the HOF (Pujols, Betts), or has a fringe-HOF resume (Posey, Brown).
APPENDIX
Table 1: Yearly AL/NL Most Critical Player (MCP) Winners

Table 2: Franchise Leaders of Total wC

Table 3: Top 5 Players in Career wC (1995-2021)