By: S. Christopher Michaels

Defense saves runs. It is axiomatic—one of many truisms in baseball. But how many runs, really? And how would we even go about measuring such a thing?
Like most of the topics I write about here, the idea for examining defensive metrics came from a conversation I participated in on the line (online, just a funny bit). I was scrolling Twitter, and my timeline was filled with posts about which team led the league in defense. One metric, Defensive Runs Saved (DRS), was repeatedly touted as the referee. I am a natural skeptic. I was curious to see the data behind DRS before forming an official opinion.
This article offers a data-driven perspective of Defensive Runs Saved and its ability to explain win totals at the Major League level. If a deep dive into data (say that three times fast) gives you a lump in your throat, you may want to catch the next train. No hard feelings; we will see each other again for my next episode of “Saber rattling.”
You’re still here. Fantastic. I’ll get right to it, then.
To believe in any metric, I need to see its correlation with runs scored or wins. I’ve written before that runs are the currency of baseball. If you can’t directly tie your metric to run-scoring, I can’t subscribe to its purported accuracy. More importantly, connecting any metric to run-scoring becomes increasingly difficult if your metric relies on judgments instead of official statistics. Still, a well-designed measurement system may be tied only to win totals.
Defensive Runs Saved is the “flagship stat” of The Fielding Bible. I applaud their effort to codify the part of the game that has the fewest officially recorded statistics. Check out their website to learn the terms that make up the component parts of their metric. Suppose, however, you’re looking for a real-world example of DRS. In that case, I encourage you to visit Romantic About Baseball to read their June 2019 installment about the stat.
Notwithstanding my personal displeasure with judgment statistics, DRS uses a plus/minus system to evaluate whether a player should have made a particular play. More difficult plays at more challenging positions can earn a player or team more points in the system.
With that out of the way, I wanted to analyze the relationship between DRS and a team’s runs allowed for a season. To do this, I needed to compare it to a metric that already explains how runs are scored based on the component parts of in-game events. Universal Outcomes Runs (uOR) comes closest (by nearly two percent) of any runs scored estimation algorithm by explaining 99.8% of the variance in run-scoring in baseball since 1876.
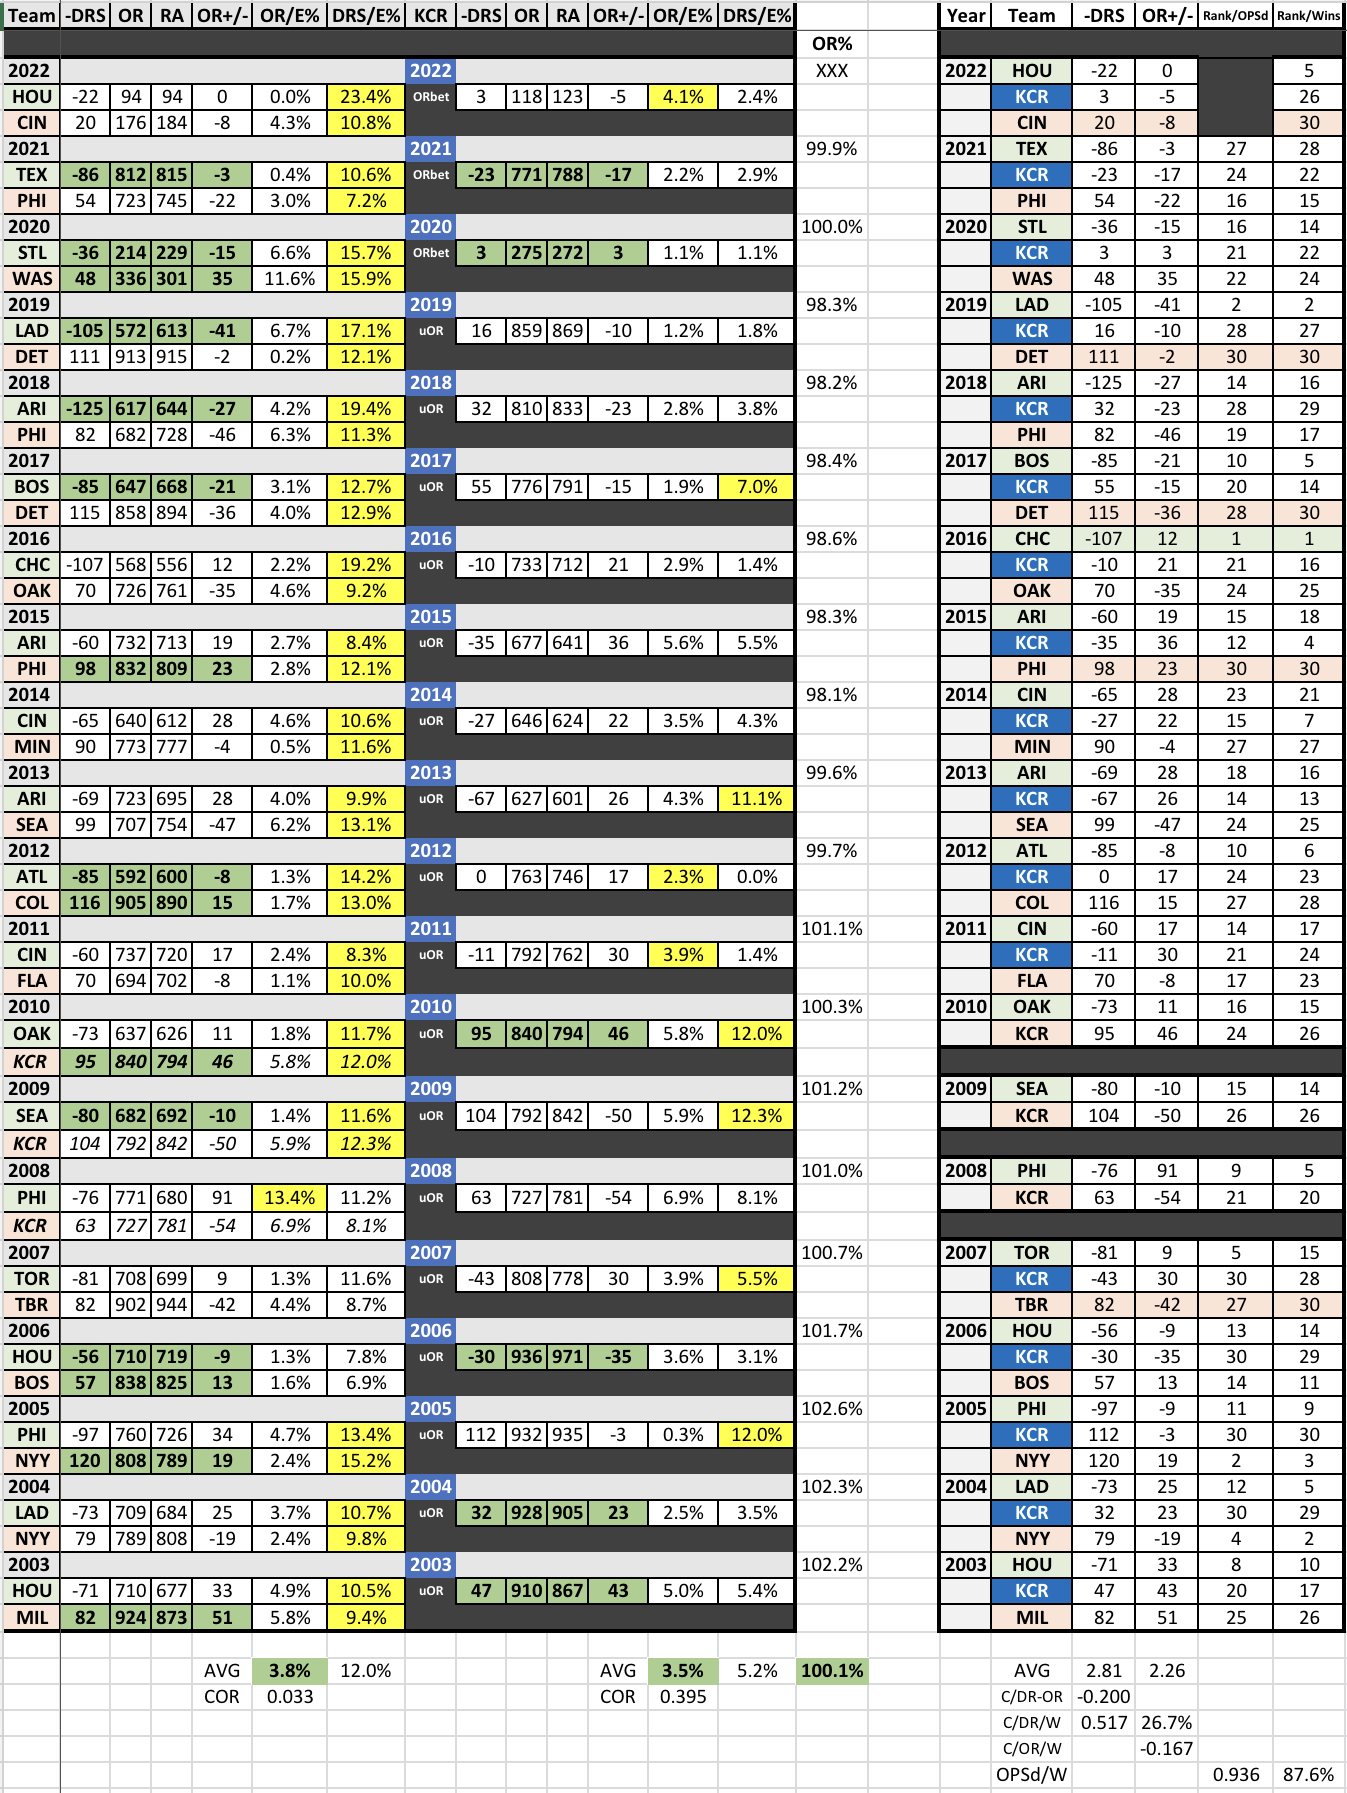
I examined team Defensive Runs Saved from 2003 to 2022 for this investigation. (This is as far back as The Fielding Bible has data for the metric.) In addition, I opted to include three teams from each season covering this period in my sample. I selected the highest-rated team, the lowest-rated squad, and the Kansas City Royals (because I love them and it’s my study ) as my test subjects. If the Royals were rated highest or lowest for a given year, I used only two teams from that season.
To accommodate my old eyes and feeble mind, I inverted DRS into something I refer to as negative-DRS (—DRS). Essentially, —DRS helps me envision saved runs as a negative number I can remove from the whole. When I began the experiment, my sense was to highlight trends in how well uOR explained run totals for each team in the sample based on runs judged to be saved or lost to defensive play. Higher-rated clubs (according to DRS) should have given up fewer runs than my algorithm suggests because of their performance. Conversely, lower-rated squads should give up more runs.
If DRS actually measures runs saved or lost, it should provide a better explanation of seasonal totals than my algorithm (uOR).
Defensive Runs Saved was also expressed as a percentage of a team’s total runs allowed for each season in the sample. If Outcomes Runs (whether uOR or the hyper-charged betting algorithm based on the most recent seasons) explained total runs within a smaller margin of error than the DRS total percentage of runs allowed, then Outcomes Runs (OR) provided the superior measurement for that selected sampling. For the record, OR explained an average of 100.1% of all league-wide runs scored from 2003 to 2021. The low during that period was 98.1%, and the highest was 102.6%, offering a total range of 4.5%.
After identifying the relationship between DRS and runs scored, I wanted to examine how well DRS explained team win totals. I ranked each team in the sample based on their final position in wins for that specific season to carry this out. Correlation data is provided for DRS’s relationship with win totals.
I know you’re burning with anticipation…
Trend data describing the observed value of DRS was inconsistent. Of the fifty-seven team seasons in this study (the Royals were the lowest-rated team three times), 35.1% (20 of 57) of the team seasons showed overlap with Outcomes Runs regarding a team’s defensive rating. In these instances, OR either underexplained or overexplained the total runs allowed based on that team season. My algorithm (OR) did not accurately describe some percentage of the total runs allowed. I noted the observation when these descriptions trended in the same direction as DRS.
For example, the 2019 Los Angeles Dodgers were the highest-rated defensive team in DRS for that team season. DRS claimed the Dodgers saved 105 runs that season. According to The Fielding Bible, the average defense saved 12.6 runs in 2019. By comparison, the OR algorithm underexplained the Dodger’s 2019 season by 41 runs out of 613 runs allowed (6.7% margin of error). It is not unreasonable to speculate that these runs were saved by defensive play and, therefore, unable to be explained by the OR algorithm.
The opposite is true for the 2010 Kansas City Royals. DRS claims the Royals team lost 95 runs due to poor defense. The Fielding Bible reported the average defense lost 1.5 runs in 2010. Outcomes Runs overexplained the Royals’ 2010 season by 46 runs out of 794 runs allowed (5.8% margin of error).
In 8.8% of team seasons (5 of 57), DRS reported the same trend as OR and was within one percent of the runs estimated by Outcomes Runs. This suggests that the defense may have been the cause of the error reported by OR in those instances.
The average gross total for Defensive Runs Saved was 66.3 runs saved or lost per team season (absolute value of all DRS runs). By comparison, the average gross error for Outcomes Runs was 25.2 runs per team season. We already know that OR explained an average of 100.1% of league-wide runs scored for the period tested. Outcomes Runs also explained an average of 100.3% of runs allowed for the sample team seasons (39,941 OR runs versus 39,796 actual runs allowed).
The Outcomes Runs algorithms only use officially recorded defensive statistics in their formulas. The percentage of runs scored explained by these algorithms suggests that Defensive Runs Saved does not correctly estimate defensive value in run-scoring. If defense were a more prominent component in scoring runs, it would cause Outcomes Runs to have a more considerable degree of variance in its explanation. This is not supported when we consider that OR explains 99.8% of all variance in run-scoring since 1876.
If you are having difficulty following this, don’t feel bad. DRS does not naturally connect to runs scored or runs allowed. In fairness, I am not sure it was intended to do so. However, to evaluate it as a metric, we have to assess its relationship—if any—to runs scored.
In its current form, Defensive Runs Saved does not correlate to runs scored.
To evaluate the possible relationship between DRS and win totals, I examined their correlation by comparing team seasons’ runs saved or lost and the final ranking in win totals among all Major League clubs for that season. There is a 0.517 correlation between DRS and win totals. Using the coefficient of determination (R-squared), we discover that defensive runs may explain 26.7% of the variance in league-wide win totals.
By comparison, On-base-plus-slugging differential (OPSdiff) has a much stronger relationship with win totals. If you’re confused byOPSdiff, it measures a team’s offensive OPS minus their defensive/pitching OPS to create an overall picture of additional value gained on the basepath. (Cyril Morong wrote about OPSdiff a generation ago. It hasn’t received the notoriety it deserves.) The correlation between OPSdiff and win totals is 0.936. This translates into a coefficient of determination of 0.876. Stated another way, OPSdiff can explain as much as 87.6% of the variance in win totals.
In fairness to DRS, four of the fifty-four team seasons from the sample were both the lowest-rated team defensively and ranked last in win totals for their respective season. This would seem to suggest that DRS does connect poor defense to a lack of wins. However, in each instance, the team with the lowest-rated defense also ranked at the bottom in OPS-differential. Given the more robust relationship between OPSdiff and win totals, it is reasonable to ascribe the final rankings for those team seasons to OPS-differential rankings. Finally, of the twenty total seasons studied, only one team with the highest-rated defense also finished first in wins (2016 Chicago Cubs). Unfortunately for DRS, that team also finished first in OPSdiff that season.
While DRS does explain some of the variances in win totals, a more viable answer can be found using OPS-differential.
I can hear my aunt’s voice in my head: defense is exciting; people go to games to be entertained.
She’s right. Defense is exciting. I want to be entertained. But the defensive plays that stand out are primarily anecdotal. In 2021, the absolute value of all Defensive Runs Saved was 1,116 runs. It sounds like a lot until you consider that more than 22,000 runs were scored across more than 4,800 team games. In 2019, the last full season, the absolute value of runs saved or lost was 1,228 out of nearly 23,500 runs scored. The point is DRS, even if it correlated with runs scored, accounts for five percent of all runs.
Yes, defense wins games. It also loses games. Again, anecdotally we can recall instances where our team won or lost on the back of a defensive play. What defense doesn’t do is directly explain win totals. Nor does it explain runs scored in the slightest. I surmise that a threshold exists above which defense is good enough. When measured with official statistics, the gap between the best and worst defensive team is less than 0.5 errors per game. The last two times this gap was above 0.5 was in 1999 and 1981 respectively. Even then, the gap was 0.6 errors per game. The last time the gap between the best and worst defensive teams was 1.0 or more errors per game was in 1932.
It tells us that good defense is, well, good. At the same time, OPS-differential tells us that having a sufficiently good offense AND a sufficiently good pitching staff/defense is far more critical.
So, let’s cherish good defense when we see it. Let’s remember it’s entertaining. It may even help us win three additional games each season. That matters in a pennant race. Is it worth fielding the best defensive team at the cost of OPS-differential?
As always, a huge thank you and link to Baseball-Reference for their outstanding data.
I hope you’ve enjoyed this column. I want to challenge your thinking about baseball statistics. Someday, my own research on the game will become outdated. Please feel free to spar with me about the ideas I’ve presented here—I enjoy the discussion because it challenges my thinking. I can be reached here on Baseball Almanac, via email at christopher.s.michaels@gmail.com, and I’m on the social media (Facebook, Twitter). As always, this has been the World According to Chris. Thanks for tuning in.