Welcome to another edition of Saber rattling. Another day, another dollar—well, I haven’t seen many dollars yet from this enterprise, so let’s cross our fingers.
I know I promised to share my thoughts on the pitching award candidates (I won’t refer to it by the title of the fella who it’s named after). And I will be writing that piece during the World Series. Today’s column is about an algorithm I created at the behest of some acquaintances. Well, I wasn’t so much ordered to design a different algorithm as I was implored for the good of humanity (laugh track).
The algorithm I want to discuss with you today is not the version of Predicted Outcomes Runs (pOR2) I’ve referred to over a handful of articles. Instead, I created a tool from that historical data set to look at how runs are scored right now in baseball. You see, while pOR2 is incredibly accurate, the tuning of the algorithm’s formula requires each event in a game carry a consistent weight, whether it happened in 1876 or 1994. It provides us with what I’ve referred to on multiple occasions as the roadmap of baseball. It’s also where the previous cartographers went wrong when trying to determine appropriate relationships between events and runs scored.
Consider these examples. A stolen base in 1894 needs to weigh the same as a stolen base in 2012. The same is true of being hit by a pitch or a double play. Changing the weight of an event within the historical algorithm to match its value to its era implies the algorithm can not adequately measure (or map) baseball. It also suggests that we needn’t develop tools that accurately compare players across different generations.
I happen to think comparing players from different eras is a worthwhile endeavor. I also believe that historical algorithms are necessary screening tools to better understand where runs come from in baseball. My conversations on social media reinforce this belief as I frequently encounter folks who either discount or disparage the data to their detriment. It serves to remind me that the most significant value of the historical Predicted Outcomes Runs algorithm is its ability to serve as an educational tool about which events truly matter within games.
Everything I’ve shared up to now is the backstory for what I want to discuss. The algorithm I created that looks only at baseball as it exists now couldn’t have been made if I hadn’t already done the work of developing the historical algorithm. It provided the starting point to identify how to accurately measure the value of events within games played during this postseason.
Alas, I will not be sharing the formula of the modern-day algorithm. It is proprietary because I am using it to demonstrate the integrity of all my evaluative tools. I am also sharing it with some folks who enjoy legally betting on baseball.
If the idea of sports betting turns your stomach, I’m okay with that. I’ve decided that I am unwilling to wait decades—as Bill James did—for baseball to grudgingly recognize they are wrong about evaluating specific events and the players who produce those events. Long story short, if you want to change the game, go where the money is. If I am correct—and I believe I am—the sportsbooks will help me change baseball by demonstrating that we can accurately decipher what actually matters.
The value of accuracy shouldn’t need to be underscored. Unfortunately, our national pastime has a seedy history of ignoring the very tools that provide for increasingly precise measurement of the many events that make up a baseball game. To address that, I decided to look only at the last three full seasons (2018, 2019, and 2021) to supercharge my algorithm. After making some adjustments under the hood, I increased the correlation between the algorithm and runs scored to a whopping 0.9998, with a standard deviation of 0.127%. For the three-year sample, I estimated the number of runs scored within six total runs (67,113 estimated runs versus 67,107 runs scored). Put another way, out of 14,578 team-games (each game of baseball counts as two team-games because two teams are playing against one another in the same game), my average runs per team-game error rate was 0.000.
In a sentence, I’m thrilled with the precision of my betting tool algorithm.
I knew I had to put my money where my mouth was. One of the issues that plague any statistical research is the sample size. The historical pOR2 algorithm examined more than 461,000 team-games. The betting tool algorithm incorporated more than 14,500 team-games. Still, I wanted to be so precise that I could estimate individual team-games within fractions of a run.
My testing sample was the 2021 postseason. Thus far, it amounts to 62 team-games of high-stakes baseball where each series leads to another team going home and fans full of disappointment. In this environment, there is no proverbial tomorrow. Accurately estimating runs based on game events is a must.
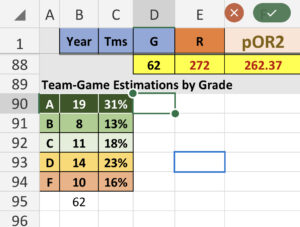
If I could estimate a team’s runs scored within ½ run, it warranted an ‘A’ grade for that team-game. If I was within one run, it received a ‘B.’ Within 1 ½ runs yielded a ‘C,’ while estimates under two runs garnered a ‘D.’ Any team-game where I was off in my estimation by more than two runs resulted in a failing grade.

The table above shows the total number and percentage each grade occurred. While a 2.194 GPA isn’t something to run home and humble brag about to mom and dad, it demonstrates the challenges of estimating individual team-games from a sample of more than 14,000 games. At the same time, I encourage you to embrace the data here. Only ten team-games were missed by more than two runs scored. That leaves 52 team-games estimated within two runs. More importantly, 61.3% of all games were estimated within 1 ½ runs.
The breakpoint of 1.5 runs is essential. It represents the expected spread a sportsbook offers for Team A or Team B in any given Major League Baseball game. In fact, if you come across a different spread, you should ask yourself what the bookies know that you don’t. Moreover, since sportsbooks are in the business of making money, betting on the accuracy of their run line (spread) could net quite a return when your algorithm has a game-to-game precision of 61%.
Before I go any farther, I am not a gambler. Before testing the waters with my algorithms, I had never made a sports bet in my life aside from the occasional March Madness office pool. As a bettor, I leave a lot to be desired. I imagine a good deal of that is because I only know enough to get myself in trouble. You see, I have made 16 bets this postseason. I am 8 – 8 over that stretch. I started out with a stake of five dollars. At one point, I had over twenty dollars in my winnings. As it stands today, I have $9.94. While not impressive, it still represents a 98.8% return on my original investment.
I never realized my allies in this fight would be the gamblers. I received daily requests for tips from my betting tool on social media. Even after losing bets the night before, I still woke up to DMs asking which way to bet each day. I can’t help but appreciate the straightforward outlook that sports bettors exemplify. If you make them money, they will return. In truth, it’s a lot like statistics. I rely on dispassionate analysis of the data to draw conclusions. Money men place a similar reliance on tools that return their investment.
The marriage between advanced analytics and sports betting has probably been around for years. The gatekeepers of baseball culture, including the nouveau riche, can ignore or decry the union as unholy until they are blue in the face. None of that will slow the shift in power towards the little guy with a laptop and microphone.
I’m just a minnow in a big pond. Still, I believe in my data because I’ve seen the regression analysis (that’s just college talk for proof). I got lucky because two bigger fish believed in me (no, I’m not fat-shaming when I say BIGGER fish). The first is the gentleman who owns and operates this site. He prefers to remain behind the scenes, so I will not share his identity. He was open to a fresh perspective on baseball history. It’s what I try to provide through my articles on sabermetrics. The second is a podcast host named Arch. He incorporates advanced analytics into his sports betting show. Each man loves baseball, yet each yearned for a better explanation to describe our beloved game. Whether the historical pOR2 algorithm or the SCMichaels MLB Betting Tool version, increasing accuracy to provide more clarity has always been the goal. Don’t take my word for it; just follow the money.
SCMichaels Betting Tool Public Data
I hope you’ve enjoyed this weekly column. I want to challenge your thinking about baseball statistics. Someday, my own research on the game will become outdated. Please feel free to spar with me about the ideas I’ve presented here—I enjoy the discussion because it challenges my thinking. I can be reached here on Baseball Almanac, via email at chriswrites@schristophermichaels.com, and I’m on the social media (Facebook, Twitter). As always, this has been the World According to Chris. Thanks for tuning in.

