By: S. Christopher Michaels

Everyone knows how runs are scored in baseball. Just ask them…
It seems simplistic. If you ask ten different baseball fans where runs come from, you’ll get a handful of answers—maybe two handfuls. The problem with these common-sense answers is they are incomplete. As a result, it sends fans and baseball executives scampering down dead ends to draft or sign the next big name which fits those preliminary conclusions.
I should tell you about me before I address these incomplete conclusions. You see, I’m an academic at heart. I love asking questions. I’m not afraid of wrong answers or intellectual dry holes. I tend to think about baseball very differently than the folks I know. Sometimes, they smile and nod at me. I know they are being polite and placating my occasionally wild ideas. All the same, I press on to find answers if for nobody else but me.
Furthermore, I am deeply immersed in data in my paid job (hey, a man’s got to do something to make a living…). I parse numbers for real-world scenarios that impact present decision-making and future planning. Finally, I once held a paid research assistantship for a major university. I may not be Neil deGrasse Tyson, but I’m no stranger to the scientific method.
Getting back to the enigma of signing big-name players, it’s hard to blame people for getting excited at the idea their team secured the final piece of the puzzle. Off-season free agency is referred to as the Hot Stove. Each December, management has Winter Meetings where ideas are discussed for the upcoming season, and players are swapped between would-be contenders. The in-season trade deadline has a run-up that lasts weeks. Sports media types speculate about which players will be moved and why. The truth is an entire boutique industry exists to theorize the perceived value of buying and selling players as commodities. It makes for entertainment. Unfortunately, it further complicates those incomplete conclusions about where runs come from.
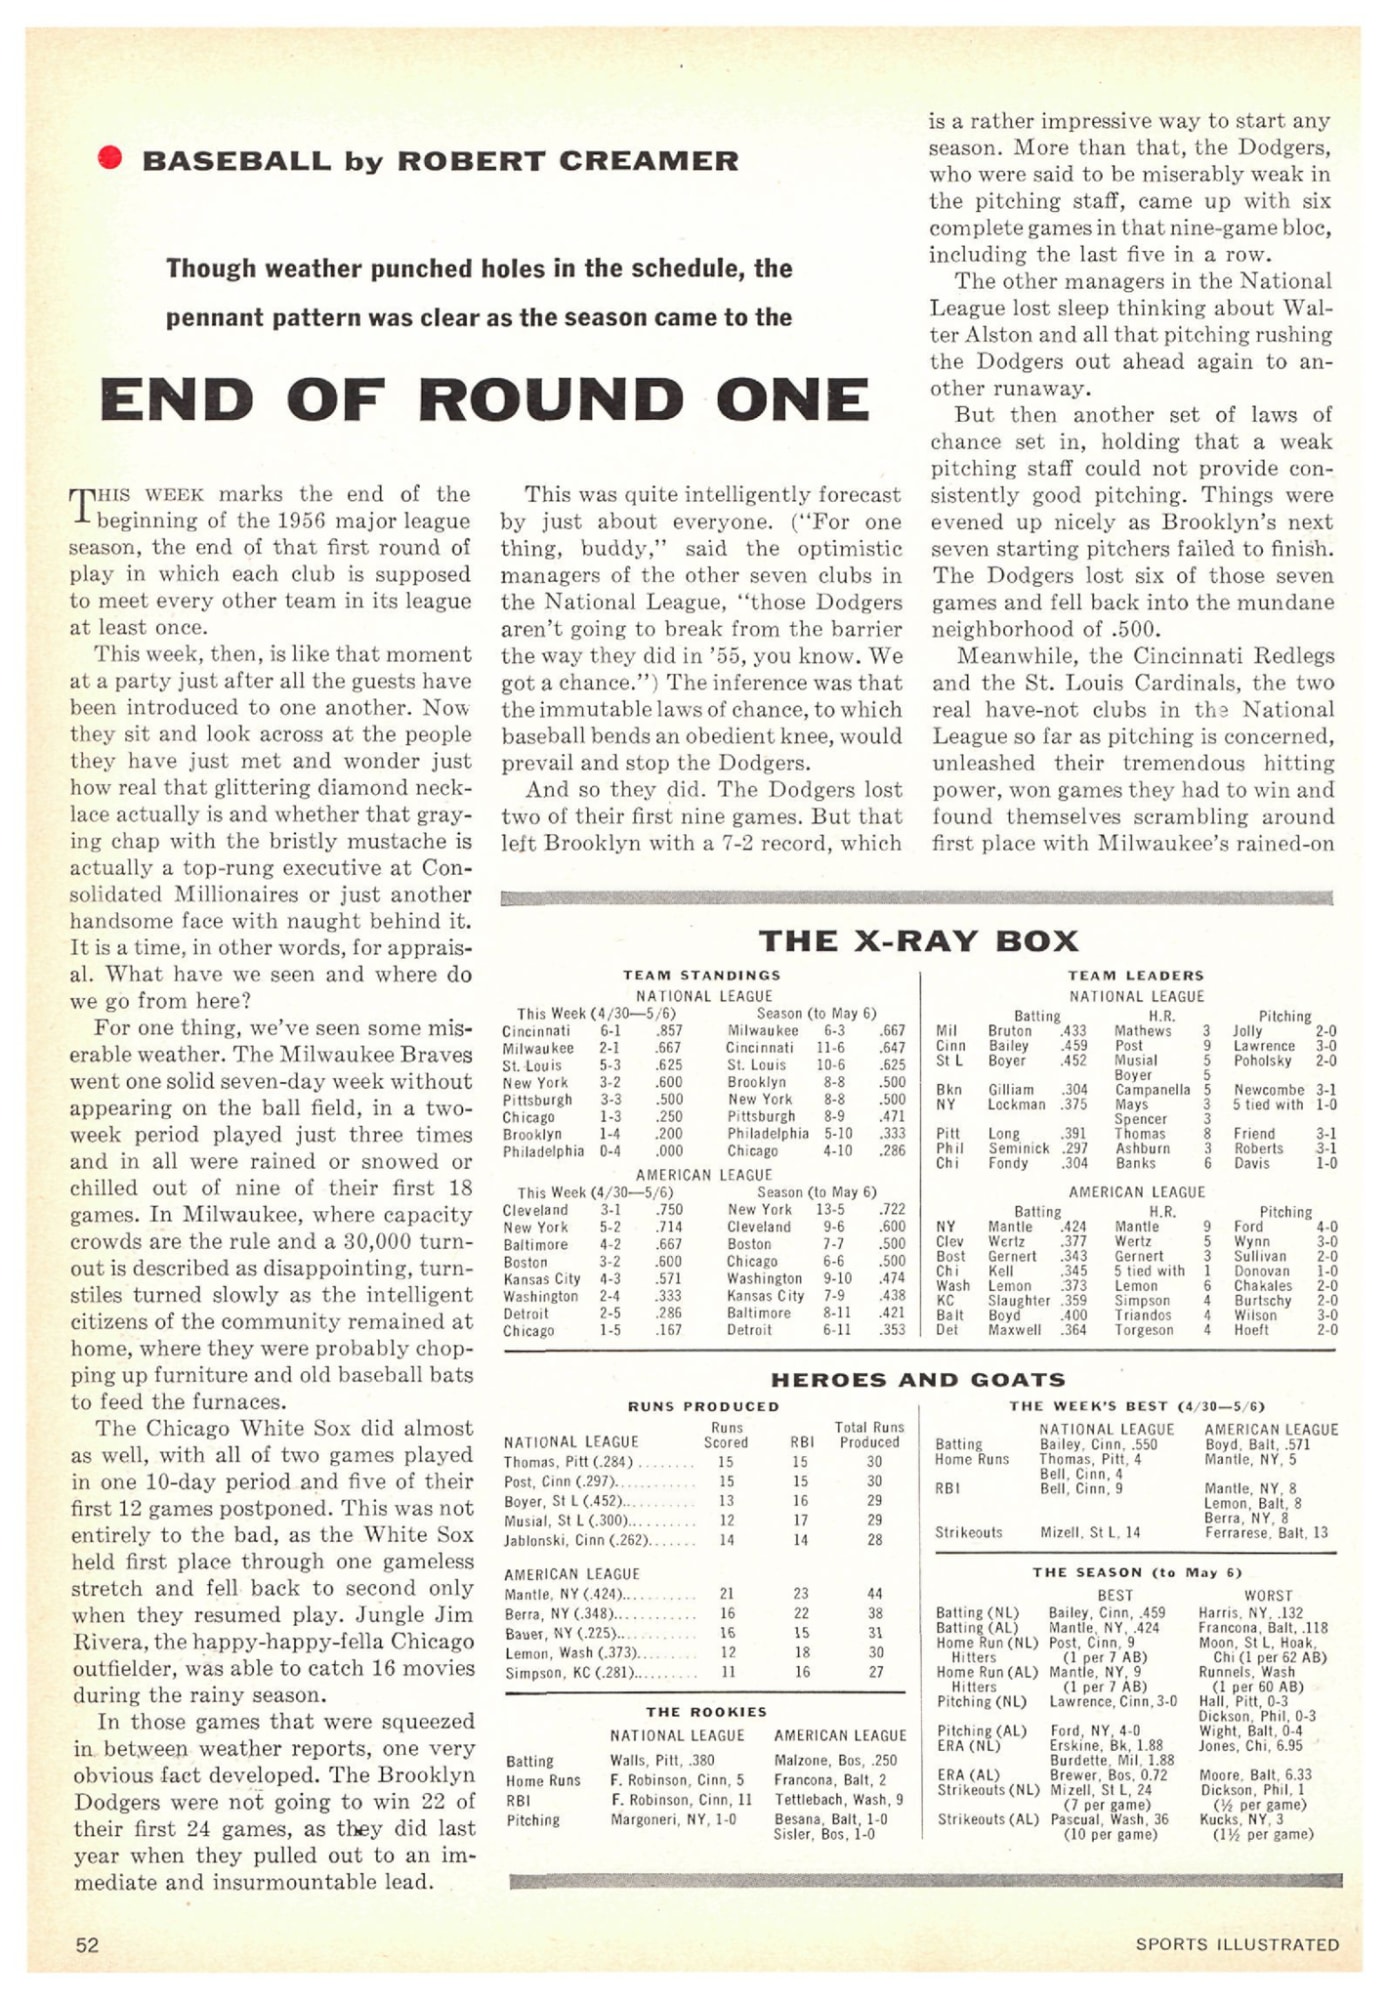
The issue of statistical analysis in baseball is that the game has moved from one unchallenged orthodoxy to another since the 1800s. It began with Chadwick’s box score in 1859, continued with Sports Illustrated and The X-Ray Box in 1956, and seems to have culminated—at least for fans and pundits—with Bill James’ work chronicled in Michael Lewis’ 2003 bestseller, Moneyball. We know that teams now hoard data scientists, but their findings are proprietary and only made available to the public when the information has become common knowledge across the game. Still, there isn’t widespread outrage across baseball’s fandom for comprehensible data (aside from SABR), nor does there seem to be any clamor for understanding the game’s original truth: the precise components of scoring runs.
For me, baseball is like economics. It’s no secret that runs are its currency. Teams, players, managers, and front offices continue to wrestle with the scoring question much the same way a family or business juggles monthly expenses while weighing their options about how to bring in more money. There is a concrete reality of scoring runs here and now. There is also an abstract conception of taking advantage of market inefficiencies to unearth ever more ways to score (read: Bill James and sabermetrics).
But understanding run-scoring goes beyond American baseball. There is a universal truth buried underneath.
We already know baseball’s currency. That currency has an exchange rate between leagues around the world. Incoming players from foreign leagues may see their production fluctuate in the same way that business markets use those exchange rates against competing currencies. At the end of the day, all runs are used to produce—or buy—wins. Again, this isn’t groundbreaking. These ideas have gained acceptance in the marketplace of baseball. Still, our continuum of unchallenged orthodoxies hasn’t delivered the precision required to explain the component parts of scoring runs. It brings us right back to the incomplete conclusions I mentioned in the first paragraph.
Attempts were made. Bill James gave us Runs Created. David Smyth developed Base Runs. Numerous incomplete theories attempt to explain the components of scoring runs. James, Smith, Jim Furtado, and Paul Johnson have done incredible work in furthering our collective understanding of these components—they brought us closer to finding baseball’s original truth. Yet, their work is incomplete.
None of them ever published research on scoring runs from the first half of baseball. Each of their algorithms (an algorithm is essentially a formula you use as a recipe) completely ignores the first seventy years of codified professional baseball. No mention is made in their work of the Negro Leagues or foreign leagues. Frankly, it’s hard to have faith in any universal theory that fails to even consider so much of what it is supposed to describe.
How confident are you to fly in a plane built by someone who ignored half the history of flight?
I want to be clear that I have great respect for these men. Bill James never claimed to be a statistician. He stated that he did not want people to take his work as a final answer—he hoped it would create more questions. Also, he’s a fellow Kansan, so he has a piece of my heart for that fact alone. At the same time, if Mr. James were to conduct further research, I imagine he would agree that previous conclusions are not nearly as accurate as we once believed. This is where the power of modern computers comes in.
A good chunk of the current analysis is done through a process called machine learning. In a nutshell, this is where a computer automatically adjusts the originally programmed algorithm based on the data it is calculating. Think of a social media platform and the timeline you see on your media device.
I have nothing against machine learning. I’m not sure I understand it well enough to know if it can describe the component parts of scoring runs with near-perfect precision. I don’t want to imply a computer couldn’t be programmed to do this. I do believe the human element of baseball still requires the human mind to hypothesize the possible implications of the structure of the rules on the outcome of events within games. (For the record, I wrote my algorithms by hand and used a computer to check my math.)
Our baseball forefathers and their incomplete orthodoxies had moderate success. So as not to bore you with the regression analysis data, I’ll compare their findings to the statistical significance of a metric we’ve used for years: the run batted in (RBI). In lay terms, statistical significance describes how likely a data outcome results from chance. RBIs have a near-perfect relationship with runs scored (higher than any other recorded stat).
Let’s use RBIs as our baseline measurement for the strength of a data model regarding how well it explains the component parts of scoring runs. RBIs act as a near-perfect traditional description of scoring runs in this example. Think of the RBI as the standard-definition tube television that once dotted so many living rooms and dens across the United States.
- David Smyth, author of Base Runs (BsR), can accurately describe 82% of the run-scoring described by RBIs.
- Jim Furtado, author of Extrapolated Runs (XR), can accurately describe 79% of the same.
- Paul Johnson, author of Estimated Runs Produced (ERP), also accurately describes 79%.
- Bill James, author of Runs Created (RCt, as the technical version, is his latest published effort), can accurately describe 78%.
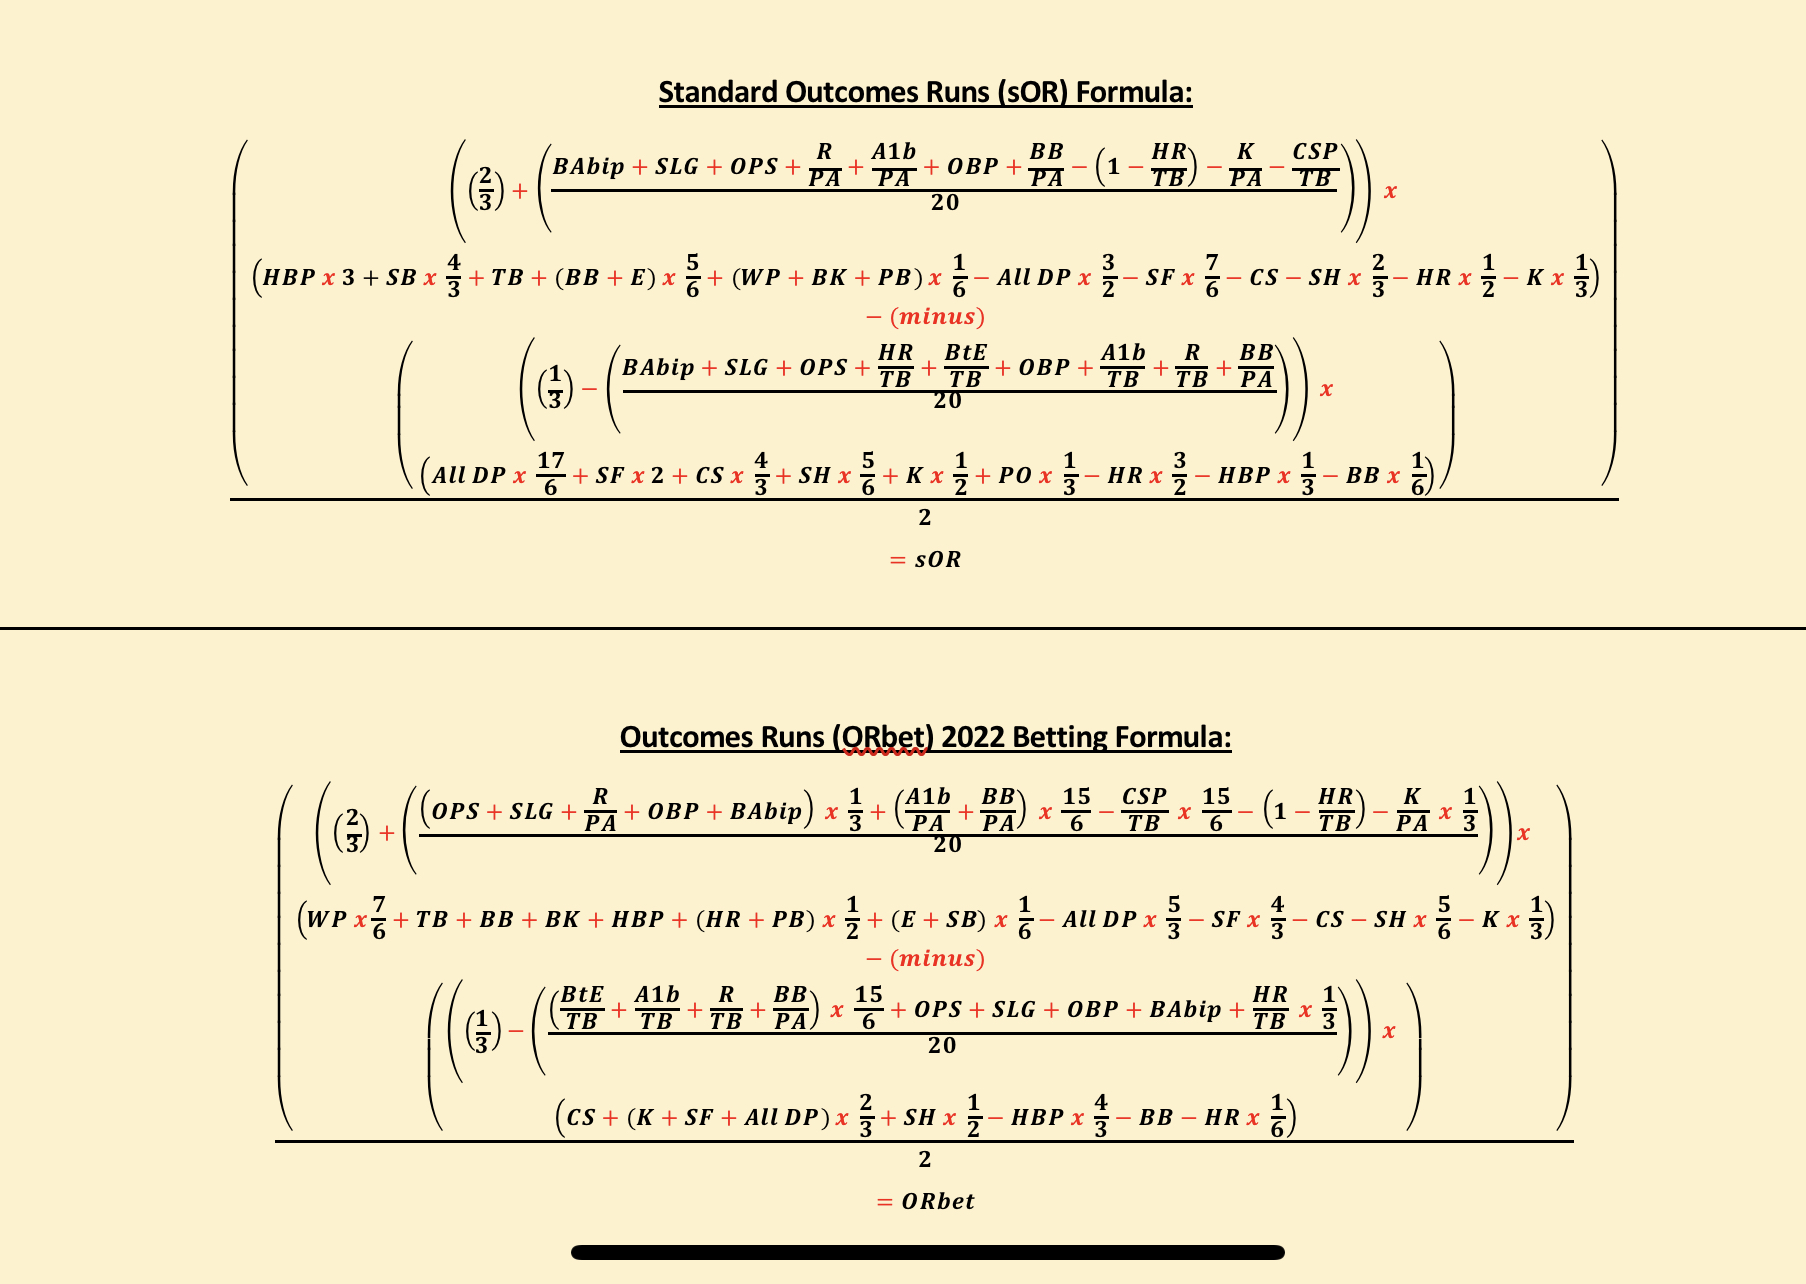
- Standard Outcomes Runs (sOR), my own algorithm, accurately describe 141% of the RBI run-scoring model.
No previous effort to unearth the truth about the components of scoring runs was as successful as simply reading the number of runs-batted-in a team or player accomplished. These men get an “A” for effort. At the same time, I wanted to do more than just put forth an effort. I didn’t want an answer; I wanted the answer. If RBIs are the standard-definition description of run-scoring components, Standard Outcomes Runs is the 4K ultra-high-def model. Moreover, sOR includes available data on the Negro Leagues AND more accurately describes foreign baseball leagues (to the tune of ten-trillionths versus billionths).
As far as I’m concerned, why wouldn’t we want a model that included all known professional Major Leagues in American baseball? Why wouldn’t we want to capture the goings-on in foreign baseball? If the goal is academic, why wouldn’t we want to be so accurate that only chance can describe the remaining 0.001 relationship to the component parts of scoring runs?
Knowing the component parts of scoring runs is not enough. As fans, we should use this data to better understand what is happening on the field and why. It should inform the analysis of our team’s success. For front office personnel, knowing and reconciling this data should guide every decision, from who to draft or sign to the philosophical or strategic approach an organization takes to fielding the best team possible. For coaches, the data should guide the tactical work done on the practice field and the recorded product in official games. Unfortunately, it isn’t happening. When we watch specific players continue to commit the same uninformed component mistakes, it isn’t happening. Take bunting, for instance.
In the best-case scenario, a batter uses a bunt to attempt to collect a base hit. If the batter is unsuccessful, he costs his team between 0.02 and 0.06 runs. While that doesn’t seem like a considerable loss in run value, it’s essential to keep in mind the batter hit a ball directly in front of six men (including the pitcher and catcher) who only have to scurry a short distance to make the play. Bunting for a base hit—and remember, this is a best-case scenario—is such a low-reward play that it boggles me to still see it (ahem: Royals).
In its uglier form, a batter uses a bunt to advance a runner from one base to the next at the cost of an out. In this instance, the bunt has a much higher price (if you are curious how, email me or find me on social media) because the base runner loses positive value relative to the outs remaining before the bunt was attempted. The run-value cost of a sacrifice bunt is anywhere between 0.33 – 0.35 runs. I cannot fathom using this in-game component event unless a team is playing for only one run to tie a game in the late innings.
Numerous decisions should be reconsidered based on a more complete understanding of the component parts of scoring runs. After all, baseball is a thinking game. Until fans demand their beloved franchise make data-driven decisions, we will likely continue to watch varying levels of inefficient gameplay. I do hope I live long enough to see baseball played by those who know the run-value of what they’re doing. Until then, I will continue to insist that baseball clings to yet another incomplete conclusion drawn from the latest unchallenged orthodoxy.
I hope you’ve enjoyed this column. I want to challenge your thinking about baseball statistics. Someday, my own research on the game will become outdated. Please feel free to spar with me about the ideas I’ve presented here—I enjoy the discussion because it challenges my thinking. I can be reached here on Baseball Almanac, via email at christopher.s.michaels@gmail.com, and I’m on the social media (Facebook, Twitter). As always, this has been the World According to Chris. Thanks for tuning in.
Postscript Notes:
A huge thank you to Baseball-Reference for the use of their data!
Algorithms Comparison:
sOR- Algorithm Comparisons – BsR, ERP, Original OR, RCt, and XR – Public
Standard Outcomes Runs – Algorithms Comparison – Regression Analysis – Public
Outcomes Runs calculators for teams, pitchers, and batters:
2022 ORbet Outcomes Runs Calculators Final – Public
Outcomes Runs Calculators – README – Public
P-values of run scoring models:
- Runs Batted In: 3.9222e-135
- Runs Created Technical (RCt): 6.7934e-106
- Extrapolated Runs (XR): 4.2249e-107
- Estimated Runs Produced (ERP): 3.0875e-107
- Base Runs (BsR): 2.858e-111
- Standard Outcomes Runs (sOR): 2.695e-191