Think of any big league player from your childhood you idolized. Chances are he was at least a star on the local or regional level. Perhaps, he was even a national superstar, adored by all.
Why did you admire him? Was it his fantastic ability to smash 450-foot home runs? Did he throw a wicked breaking ball that fell off the table, buckling batters’ knees at the plate? Was he a wizard with the glove? Or was he a player who seemed to go unnoticed among the superstars on his team, still producing at a high level while others paid little attention?
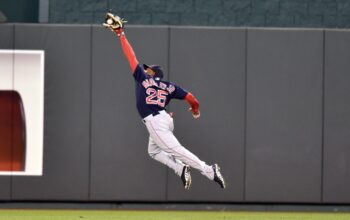
If the final example describes you and your idol, you’re a better man than me. I worshipped a superstar—George Brett, to be precise. Whether at the ballpark or watching on TV, each time Brett came to the plate, everything around me stopped as I homed in to study his at-bat.
The king of the Royals was highly effective. It was apparent to anyone watching, friend or foe. As impressive as Brett was, players like him are not the focus of this column. It’s not that dissimilar from Supreme Court Justice Stewart’s 1964 declaration, “I know it when I see it.” Obvious examples of effective baseball are, well, obvious. The problem is it creates flimsy logic that is arbitrarily applied.
No more.
Just as too many in baseball cannot describe the specific combination of events that produce runs, there is no consensus on what defines effectiveness. For starters, effective baseball means producing runs on offense and preventing them while on defense. Again, it seems like something that this point should establish, but that’s clearly not the case when you look at various stats still recognized as markers of success like a pitcher’s earned run average, a fielder’s range factor, or a batter’s on-base percentage.
Sure, these are valid measures of performance. Of that, there is no doubt. All the same, they’re the equivalent of warning lights—once referred to as idiot lights—on your car’s dashboard because they serve only to tell you something is wrong with the vehicle. An ERA is the least lousy pitching metric for its proximity to the only thing that actually matters in baseball—ahem, runs. Sadly, the very statistic—earned run average—designed to translate raw data into a measuring stick only has a 67% relationship with how runs are scored. You may be thinking, wait, that’s the EARNED portion of the equation. If only it were that simple. Earned runs—not the part further divided into an individual pitcher’s average—have a 92% relationship with runs scored. For reasons known only to the Oracle, the strength of that relationship is ignored in favor of a pitcher’s digestible average, although it is significantly farther removed from the thing it is supposed to measure.
The problem exists all over baseball at the player evaluation level. WHIP—the new and improved measure for pitchers—has a distant 39% relationship with runs scored; fielding percentage fairs a bit better at 52%; and range factor—that end-all for understanding a player’s true fielding ability has a 60% relationship. Of the top ten singular measures I considered for understanding and describing player effectiveness, only three are regularly used: BAbip, OPS, and slugging. I was forced to either design the other measures myself or pull them off the scrap heap to explain how players produce or prevent run production. But, enough of my sob story—after all, there’s no crying in baseball.
Everything I’ve said thus far is the backdrop to designing metrics that accurately measure player effectiveness. It’s a preamble that sets the stage, listing the long train of abuses and usurpations that must be addressed for all of us to understand which players are worth their salt and which ones are not. As I mentioned earlier, effective baseball is about producing runs or preventing them. The means of measuring this series of in-game events comes down to looking at players through a different lens than we’re used to. It includes three traditional data points—BAbip, OPS, strikeouts per plate appearance—and six new or uncommon metrics. Moreover, batters are no longer measured by one set of rules while pitchers are subjected to another. Each is held to the same standard because those nine combined data points are the elements that create an effectiveness average (EFT) and a weighted historical average (EFT+).
Before you come after me with pitchforks, I freely admit I’m against weighted averages in overall runs estimation algorithms. Individual player evaluation metrics are different because the only viable way to compare players across different generations is to employ a weighted average that accommodates the pendulum’s swing towards hitting or pitching. The best way I can show you the value of this measuring stick is through a specific example. If you indulge me, I’ll use one of my favorite players to watch, Salvador Perez.
Salvy was the most effective player in the American League in 2020. I said it. I’m standing behind my declaration. The Royals catcher led the majors in total bases per plate appearances, and total base runs percentage. If you’re unfamiliar with that last statistic, it’s okay; I had to carve that gem out of granite. As a brief history lesson, David Smyth and Tom Tango brought us Base Runs (BsR) as a competing runs estimator to Bill James’ Runs Created. Total Base runs (TBR) shares only the name with the former metric. Mine is a combination of a batter’s total bases and runs batted in. When examined as a percentage, it is divided by the batter’s number of plate appearances. Its inclusion in the EFT formula is necessary because TBR is the only measure that works for batters and pitchers (runs allowed are substituted for runs batted in) with a near-perfect correlation to runs scored (0.9912). The 99% relationship to runs scored is stronger than total bases, hits, and doubles (each above 98%). It’s also more substantial than extra-base hits (XBH, 97%) and awarded first base (another stat I had to create, A1b, 95%). Simply put, it’s a must-have dipstick to see if the engine is getting enough oil to lubricate the run-producing machine.
Yilda, as Salvy’s mom refers to him, was also top-fifteen in BAbip and OPS in 2020. Frankly, it didn’t matter that he struck out more than 23% of his plate appearances or was awarded first base (walks plus hit by pitches) just over 3% of the time. These two data points are included in EFT scores because they drive the strength of this new metric closer to runs scored. At the same time, they are the two least-impactful measurements in the EFT formula. They matter but not nearly as much as the top-tier data points. In fact, in the order of their importance to understanding batter-pitcher effectiveness, total bases per plate appearance (TB/PA) is first at 99.34%, total base runs percentage (TBR%) is second at 99.04%, on-base plus slugging (OPS) is third at 96.75%, extra bases per hit (XB/H) is fourth at 90.04%, home runs per total base (HR/TB) is fifth at 80.06%, sacrifices per total base (S/TB) is sixth at 79.19%, batting average on balls in play (Babip) is seventh at 69.81%, and those as mentioned earlier, awarded first base (A1b/PA) per plate appearance and strikeouts per plate appearance (K/PA) are eighth and ninth, respectively, at 63.03%, and 44.14%. After testing dozens of variables in hundreds of combinations, these nine data points are the only standard measures for batters and pitchers that strongly correlate with runs scored. The batting formula has a positive 73.85% relationship with runs scored, and the pitching formula has a negative 73.85% relationship. Said another way, batters want to do nine separate things to produce runs, and pitchers want to stop them.
Getting back to Mister Kansas City, Salvy didn’t need to be number one in the traditional measures of home runs, walks, stolen bases, etc., because those singular statistics are not nearly as crucial to overall run production. (Read my Predicted Outcomes Runs write-ups on this blog for more information.) Digging deeper, Salvy’s performance was grossly underrated across baseball. Sure, he was awarded the Silver Slugger Award for the American League’s best hitting catcher. That’s nice. He was also ranked 17th in AL MVP voting. That’s not so nice. Perez had an EFT+ (remember, this ranks each player against the weighted season average for historical context) 19.38% above average. That’s astounding. It was the 11th best season by any major league player from 2017 to 2021. The next closest catcher on this list comes in at 41st (Will Smith, 2020). How was Salvy ranked 17th in MVP voting when he produced the best catching season in years? How did he only garner 1.9 wins above the mythical replacement player when he did the things that are actually aligned with producing runs, all while fielding the most challenging position in baseball during the century’s most unusual year for baseball? If these achievements are not the definition of underrated, then we need a new dictionary.
Unfortunately, it will take time for baseball aficionados to accept new metrics. Our national pastime is rooted in historical precedent, and that often means we are slow to accept we’ve been doing things the wrong way. Salvador Perez is far from the only player who is clearly effective in Major League Baseball while vastly underrated. Of course, this phenomenon is not nearly as evident to the naked eye as watching a two-way superstar like Shohei Ohtani wow us every game (yes, Ohtani really is that good, look at his numbers below). We have to move past the traditional measuring sticks for ballplayers because they don’t have the strength of relationship to runs scored, despite their entertainment value on the ball diamond. Until enough people are willing to push past lazy metrics, we will continue to see an alarming number of players continue to be underrated or overrated (read: Billy Hamilton, bottom-ten in EFT for three consecutive years while earning $11.5 million). I hope you’ll join me in discarding unacceptable data interpretations that don’t have anything to do with run production. To paraphrase Smoky the Bear, only you have the power to prevent lousy player evaluations.
Formulas and Player Effectiveness Rankings:
Batter Effectiveness (bEFT) = (Babip x 0.7635 + TB/PA x 0.7562 + XB/H x 0.7500 + TBR% x 0.7248 + OPS x 0.7021 + HR/TB x 0.6285 + 1 – S/TB x 0.5884 + 1 – K/PA x 0.5276 + A1b/PA x 0.3663) / 6.931
Pitcher Effectiveness (pEFT) = (1 – Babip x 0.7635 + 1 – TB/PA x 0.7562 + 1 – XB/H x 0.7500 + 1 – TBR% x 0.7248 + 1 – OPS x 0.7021 + 1 – HR/TB x 0.6285 + S/TB x 0.5884 + K/PA x 0.5276 + 1 – A1b/PA x 0.3663) / 11.068
Variables are multiplied by their correlation coefficient to runs scored. This combination of variables produced the closest relationship between EFT scores and runs scored of any tested formulas. These formulas are the inverse of one another, thereby allowing batters and pitchers to be directly compared over the same data. Finally, by norming each EFT to a historical average of 0.5000 (since 1901), weighted seasonal averages can be incorporated to determine a player’s achievement against other players across different seasons.